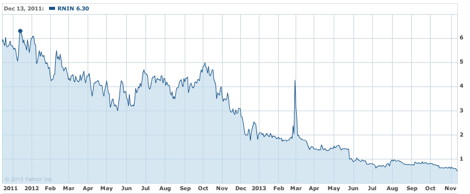
RNIN’s Two year Stock Price Chart
Adrian J Cotterill, Editor-in-Chief
We won’t predict Wireless Ronin’s eventual demise here (we’ve done that a few times before and every time, somehow they have managed to cling on and survive) but their two year historical stock price chart makes interesting reading…
That spike in March 2013 was the Samsung SoC announcement and how that was managed / manipulated AND did not result in people going to jail is still beyond me.
They are currently trading at less than 50 cents a share, with a market cap below USD 3M and as Sixeteen:Nine’s Dave Haynes says (here) “Total operating expenses are more than what the company has on hand, and is roughly equal to what Ronin loses per quarter these days”.


Follow DailyDOOH